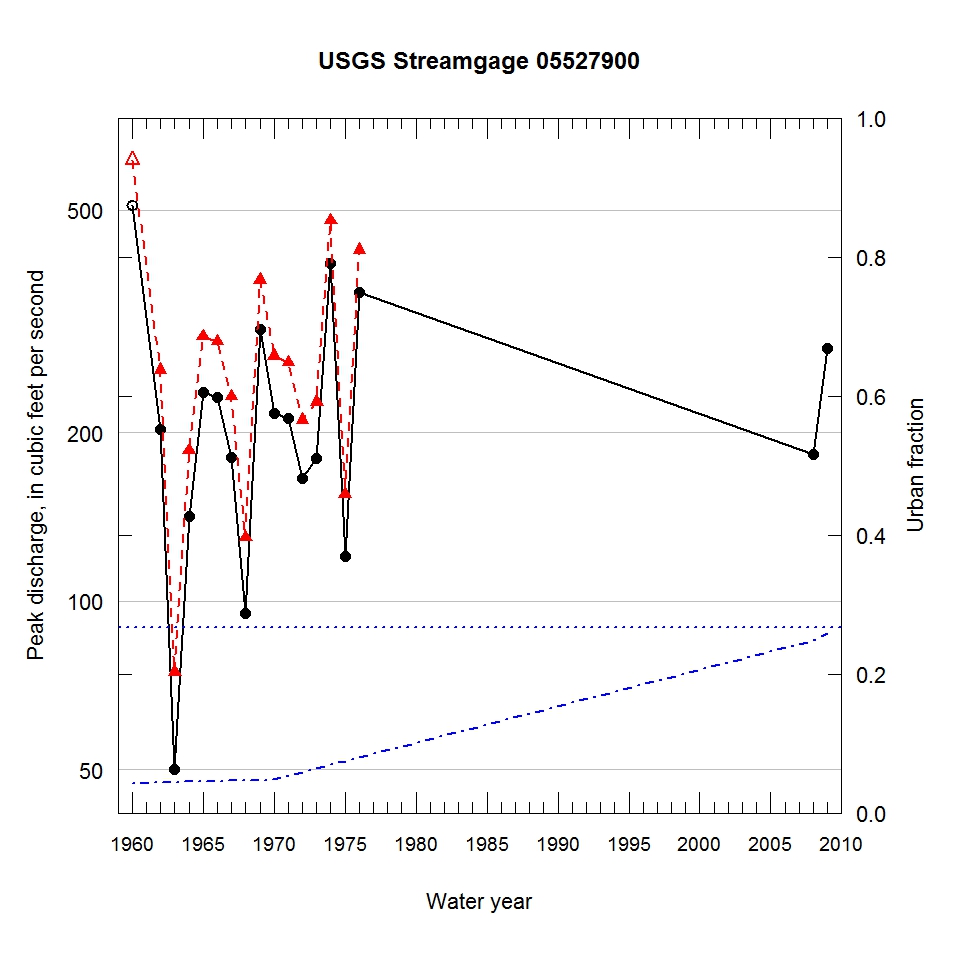
Observed and urbanization-adjusted annual maximum peak discharge and associated urban fraction and precipitation values at USGS streamgage:
05527900 NORTH MILL CREEK AT HICKORY CORNERS, IL


| Water year | Segment | Discharge code | Cumulative reservoir storage (acre-feet) | Urban fraction | Precipitation (inches) | Observed peak discharge (ft3/s) | Adjusted peak discharge (ft3/s) | Exceedance probability |
| 1960 | 1 | 7 | 1200 | 0.043 | 0.689 | 510 | 614 | 0.042 |
| 1962 | 1 | -- | 1200 | 0.044 | 0.207 | 203 | 259 | 0.430 |
| 1963 | 1 | -- | 1200 | 0.044 | 2.019 | 50 | 75 | 0.952 |
| 1964 | 1 | -- | 1200 | 0.045 | 1.444 | 142 | 186 | 0.672 |
| 1965 | 1 | -- | 1200 | 0.046 | 0.555 | 236 | 297 | 0.333 |
| 1966 | 1 | -- | 1200 | 0.046 | 0.516 | 231 | 291 | 0.347 |
| 1967 | 1 | -- | 1200 | 0.047 | 1.548 | 181 | 232 | 0.515 |
| 1968 | 1 | -- | 1200 | 0.047 | 0.478 | 95 | 130 | 0.843 |
| 1969 | 1 | -- | 1200 | 0.048 | 1.128 | 306 | 375 | 0.183 |
| 1970 | 1 | -- | 1200 | 0.048 | 2.429 | 217 | 274 | 0.388 |
| 1971 | 1 | -- | 1200 | 0.053 | 0.697 | 212 | 267 | 0.407 |
| 1972 | 1 | -- | 1200 | 0.059 | 0.532 | 166 | 211 | 0.592 |
| 1973 | 1 | -- | 1200 | 0.064 | 1.240 | 180 | 227 | 0.534 |
| 1974 | 1 | -- | 1200 | 0.069 | 1.579 | 401 | 479 | 0.087 |
| 1975 | 1 | 2 | 1200 | 0.075 | 1.041 | 120 | 155 | 0.773 |
| 1976 | 1 | -- | 1200 | 0.080 | 2.006 | 357 | 424 | 0.132 |
| 2008 | 0 | -- | 1200 | 0.248 | 0.699 | 183 | -- | -- |
| 2009 | 0 | -- | 1200 | 0.258 | 1.286 | 283 | -- | -- |

